Visualizing Science
Posted on May 27, 2015 in visualization • 1 min read
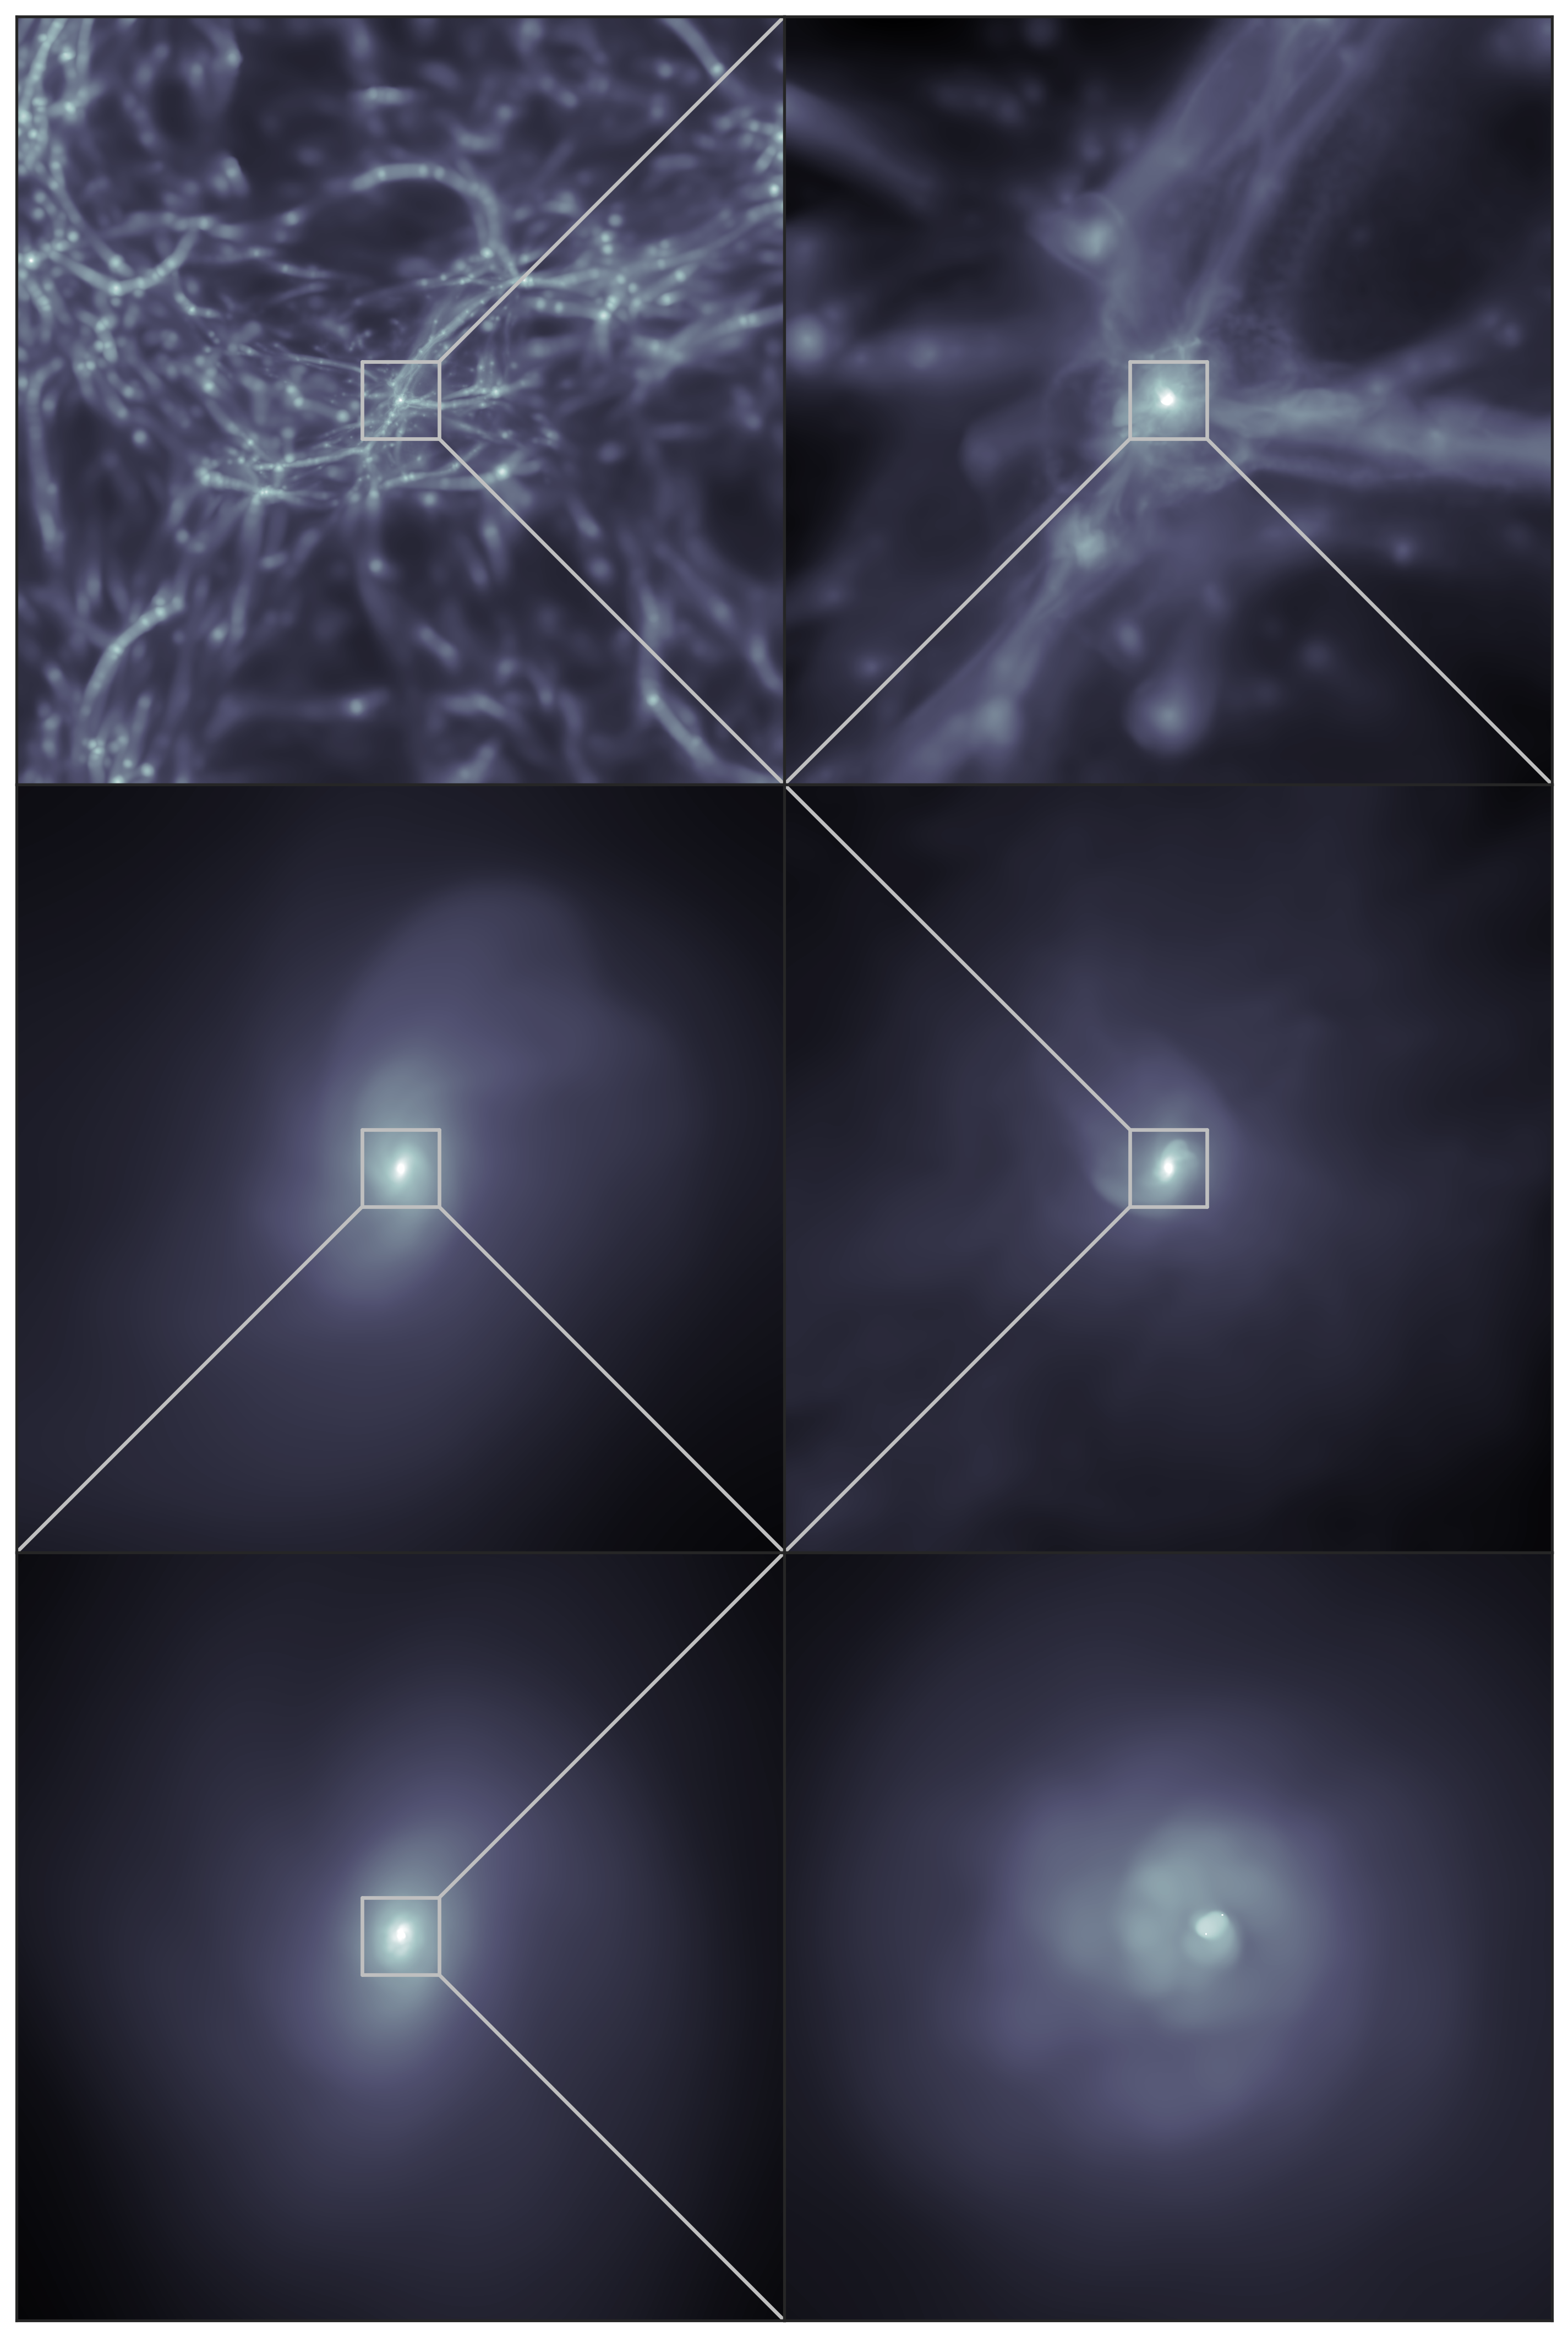
The past three years, the UT College of Natural Sciences has sponsored a science visualization contest. Cosmological simulations appear to be quite popular, having been featured in both previous contests. Here's my entry for this year's contest:
 Click to embiggen.
This image shows the formation of the first stars in this patch of the Universe, roughly 100 million years after the Big Bang (13.7 billion years ago). Color represents the density of gas collapsing under gravity, with brighter colors representing higher densities. Starting from cosmological scales in the upper left, each panel zooms in by a factor of 10. Along the way, we see the filamentary structure of the cosmic web on the largest scales, gas piling up in a dark matter 'minihalo' at the intersection of several of these filaments, virializing, and finally forming an accretion disk surrounding two high-density clumps of gas destined to become massive Population III stars in the bottom right panel. Those two white dots in the bottom right panel are roughly the size of the Kuiper belt that surrounds our Sun. The upper left panel, on the other hand, is over 16,000 light years across, and 10 million times larger.